Three Stages of Rallies or Declines
The first stage of a rally or collapse (these terms are interchangeable, albeit in inversely opposite directions) is the swiftest and most powerful move, where speculation is rampant, price dislocations are manifold, and gains or losses can mount incredibly over days or weeks. This is when some of the greatest gains are made or lost. There are warning signs that a major breakout is about to occur, which can be tracked, but are difficult to time with any degree of confidence. For collapses or long-duration downturns, the final phase is the worst.
In the second stage, direction remains the same for both rallies and declines, but at a slower pace, as initial assumptions are confirmed and is reflected in price. This phase often features series of false breakouts in the opposite direction, as in-the-money investors stand pat, but speculators on the losing side of the trade seek to reverse the reality of the situation. Eventually, any rallies or deep dips evaporate and the general trend continues, over months, from four to six months or even longer, depending on the particular asset class.
Once the trend has become crystal clear to everybody except the permanent bulls or bears, the third, and most-devastating stage develops. Strong rallies or declines commence, taking prices to levels that were otherwise unimaginable, culminating in complete and total capitulation by the forces on the wrong side of the trade.
This kind of staging can be evidenced in many rallies or collapses from an historical perspective. For reference, prior to the start of the Great Depression in 1929, there were signs that the rally that began in 1921, hence, the “Roaring Twenties”, was becoming extremely overvalued. After a massive gain in 1928, in which the Dow Jones Industrial Average (at the time, the only relevant index) rose from 200 to 300, a 50% gain over the 12 months, the start of 1929 saw the index vacillate and consolidate between 300 and 320, until finally taking off again in May, eventually peaking in August at 381. The biggest decline came from the August high of 381 to the November low of 238. This loss was massive: 38% over just four months.
With the downtrend fully established, the Dow hit 128 in May, 1931 and continued to plummet to its eventual bottom of 42 points by June 1932. The last gasps of capitulation lasted 17 months, from February, 1931 until June of 1932. The Dow had already been cut roughly in half from its all-time high, but this final phase was a loss of 78%, completely devastating.
While the evidence from dramatic drops like the 1929 crash show that the entire event took just more than 2 1/2 years, major advances can occur more or less along the same lines, with the most explosive moves at the start, rather than at the end.
In terms of advances, look at the opposite effect. Companies like Apple, Microsoft, Google, Nvidia are recent examples, but many major companies that developed after World War II bear a similar signature. In the initial stage speculation delivers outsized gains to a handful of “wise guys” and early investors with inside knowledge. The gains are abrupt and short lived, measures in time spans of under one year, usually less than six or eight months.
The second stage is when institutions get involved and begin to horde shares and hold, seeking solid returns over a period of months and years. Once the trend is well-established, the general public dives in, taking the stock or whatever asset is in focus to amazing heights.
The second phase ran from November, 2021 until May, 2024, where the market corrected from 16,057 to 10,652, in October, 2022, then rebounded to its prior high. If the final push forward is from 16,057, then the NASDAQ has a lot further to run. Speculating on highs north of 30,000 should not be discounted, though they may seem a little far-fetched at this juncture.. In fact, if measured from that November, 2021 and May 2024 area around 16,000, a gain to 30,000 would not even be a doubling. Even measuring from the low in October, 2022, 30,000 would only represent a tripling.
Whenever this bull market turns for the worse, the declines on the other side are likely to be catastrophic for buy-and-hold investors with long horizons. The initial stage will be obvious in the first few weeks and may run three to six months. The second stage is likely choppier, with hopes of a revival prevalent. The final stage is the most devastating, like in the 1929 crash, the dot-com bust or the GFC of 2008-09.
Using these examples, one can assess what’s developing in individual stocks and other assets. The greatest gains are made in the early stags of bull markets and the greatest losses in the latter stages of bear runs.
In both cases, it’s the insiders, speculators, and institutional money, hedge funds, private offices that make the best gains or take the smallest losses in the early stages, and the public that gets the meager returns at the end of bull runs or the most devastating losses at the culmination of collapses. From that perspective, it is far better to be early than late.
When it comes to gold and silver, both unquestionably in the midst of very powerful rallies, here’s a timeline to consider:
Time it took the price of gold to move from/to:
Of course, there were many peaks and valleys between 1972 and today and plenty of money could have been made trading gold, but the profits would pale in comparison to the ultimate buy-and-hold asset strategy. Looking a bit deeper, many analysts are calling the current rally one which has $2,000 as a floor, so, from that perspective, gold’s rally is just getting underway and it is advancing at a very rapid pace, given its exemplary position as the world’s most widely accepted “money.”
Using the chart on the right as a guide, gold broke through the all-time high in August, 2020, and hovered in that range until finally breaking out in April, 2024. Using that as the starting point of the rally, By March of 2025, it was $3,000, and by October was $4,000. It topped $5,000 for the first time on January 25, 2026, a mere three months later. If the real money is going to be made at the first stage of the rally - which is now - gold may very well reach highs of $10,000 this year, as the pace appears to be accelerating.
Those who thought gold was too expensive in mid-2025, at $3,000, may regret not buying any when it’s $10,000 in what looks to be the very near future.
Silver broke through its imaginary resistance at $50, which had persisted from 1979 to 2011, each time topping out just below it, and had been in the doldrums, bouncing around between $12 and $30 from 2011 to around May, 2025. On October 8, 2025, it closed above $50 for the first time ever, consolidated, and began its breakout in late November, 2025, hitting $60 in early December, $75 later that month streaked past $100 on January 23, 2026, and has continued higher.
If the rally started at $35, which may be a reasonable assumption, silver is looking at $180 or higher before 2026 ends. Taken from the $50 mark, and gold from a base of $2000, both metals are looking at seven to eight-baggers before the initial, explosive phase is done, probably sometime in 2027 or 2028.
Those calculations, based on historical stock and commodity rallies, put gold at $14,000 to $16,000 and silver at $350 to $400. These are not preposterous figures anymore, now that the rallies have been undeniably confirmed and the initial phase still early.
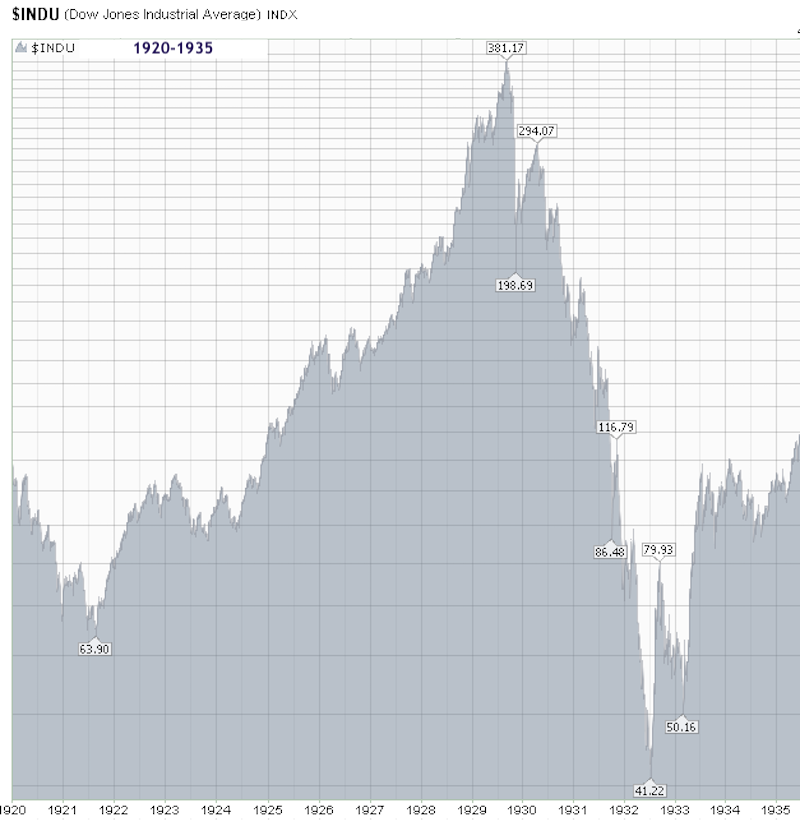 By April, 1930, the index had stabilized, rising to 286, but fell back down to 164 by December and back up to 189 by February, 1931. Those ten months were the second stage. The losses of roughly 100 points were no less severe - 34 percent - but they took longer to develop.
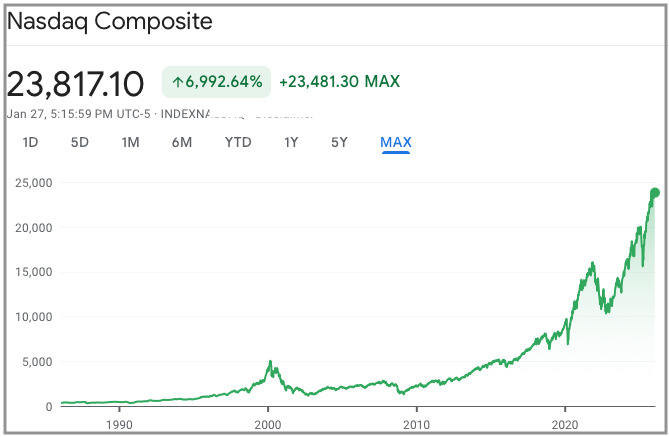 In terms of today’s great bull runs, the NASDAQ appears to be in the middle to latter part of stage three of a massive bull market that began in March 2009, at the end of the Great Financial Crisis, which, on long-term charts, appears as little more than a minor correction. The initial stage ran from 2009 (1,293) to November, 2021 (16,057). This represents an incredible gain of more than 1200%.
$35 - $1,000: 36.6 years
$1,000 - $2,000: 12.4 years
$2,000 - $3,000: 4.6 years
$3,000 - $4,000: 0.6 years
$4,000 - $5,000: 0.3 years
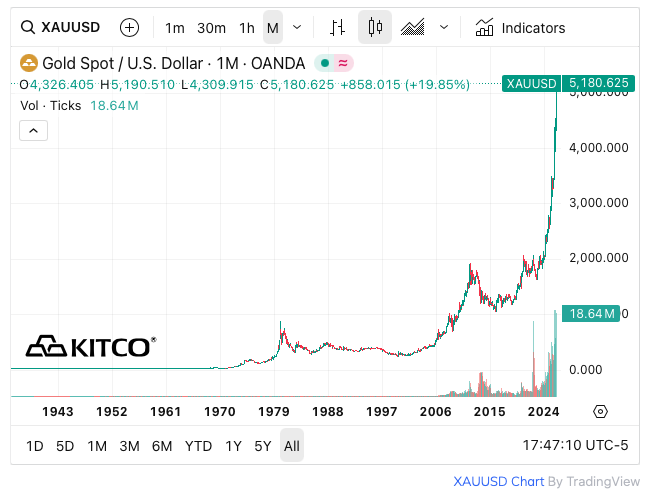 Based on the 55-year long price trend, gold should hit $6,000 in March, 2026 and may reach $8,000 later this year. This illustrated why gold is considered by historical standards to be “generational wealth.” Anybody who had the patience to hold gold for anything approaching 55 years is looking at a gain of 14,285%.
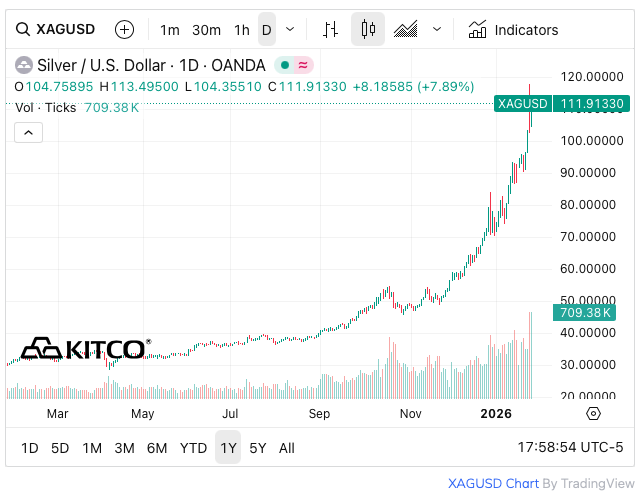 Silver is another story altogether. For many years it had been - like gold - suppressed by the COMEX and LBMA. That was until China, India, and the UAE got serious with physical markets in Shanghai, Mumbai, and Dubai as counterbalances to the paper market at the COMEX. As Andrew Maguire puts it so eloquently, the Eastern nations went from being price-takers to price-makers in both gold and silver, along with palladium and platinum and other commodities.
|
|||
| search engine by freefind |
Your ad could be in the next issue of idleguy.com for as little as $6 per month. Contact Fearless Rick using the form on page 12 for more information.
Visit the IDLEGUY.COM MARKETPLACE for vintage magazines, Swell Gifts for Guys and other masculine merchandise.
Got something to sell? Registration is free and there are no fees to sell on the idleguy.com marketplace.